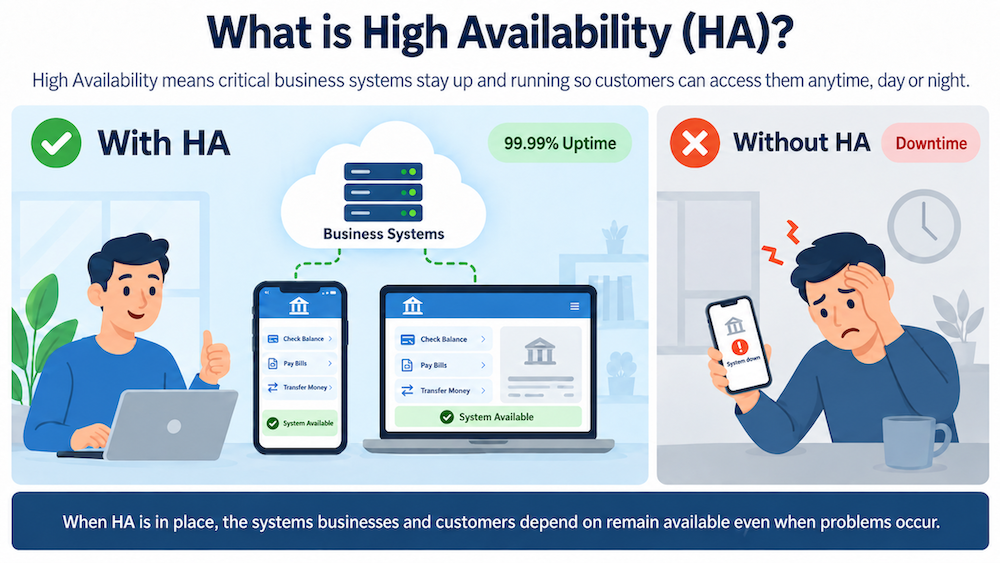
Have you ever looked closely at a container of hand sanitizer? “Kills 99.99% of germs” is usually presented prominently somewhere on the packaging. If you’re like me, that might have led you to a perfectly reasonable question: “What about the other 0.01%?” What is it about that last little bit that is so hard? We encounter the same question with HA software. You’ve likely come across the figure 99.99% when discussing HA uptime. The question remains the same: why can’t we achieve 100% uptime?
First, let’s talk about what 99.99% uptime really means. Uptime refers to the amount of time that your application is running and available to the end user. Typically, this is measured over the course of a year. To achieve 99.99% uptime, you must have no more than 52.60 minutes of downtime. On average, that breaks down to:
52 minutes, 36 seconds a year
4 minutes 23 seconds a month
1 minute 0 seconds a week
0 minutes 8 seconds a day
That’s very little time, but it’s nothing, so where exactly does it come from?
Intentional Sources of Downtime
Let’s start with some of the most inherent sources of downtime. The fact is that no matter how good your HA software is, it will always take some amount of time to perform common operations like a switchover. Any time you intentionally initiate a switchover, a very minimal amount of downtime will occur. Depending on the size of your hierarchy, this can take anywhere from a few seconds to a few minutes. To understand why this is, we need to understand what happens when a switchover occurs. At the resource level, we must first take the resource out of service on the current active node completely, then bring the resource fully in service on the new active node. Depending on the application, this could mean running a couple of quick commands, or it could mean running long and complex graceful shutdown operations, followed by a slow cold startup on the other server. At a hierarchical level, we must perform these operations one at a time in many cases. If a resource has any children, then they must be taken fully out of service before we can even begin to take the initial resource out of service; then on the other server, we must bring the children fully in service before we can even begin to bring it in service. For multi-level hierarchies, with complex switchover processes, this can really add up. This is an inherent and unavoidable type of downtime, but fortunately in most cases your end user shouldn’t notice it other than as a slightly longer load time, or a brief reconnection. It does, however, add to the downtime calculation.
Another inherent form of downtime is maintenance. Fortunately, most maintenance can be performed in a highly available manner. This means performing the maintenance on the backup node first, performing a switchover, then performing the maintenance on the previously active system. This will incur some amount of downtime as described above, but it should be minimal. There are, however, some forms of maintenance which cannot be performed in a highly available manner. In these cases, some substantial amount of downtime may occur, and drive up the total for the year.
Unintentional Sources of Downtime
The numbers really start to add up once we start looking at the main purpose of high availability software: disaster recovery. Even when everything goes perfectly according to plan, any failure will produce some amount of downtime. Let’s look first at how downtime is incurred during a successful failover. In order to properly recover from a failure, we must first detect and verify the failure. This is a difficult balancing act. If you are too aggressive with failure detection, you may detect failures that haven’t actually occurred (false failures). If you are not aggressive enough, you may be slower than necessary to detect failures. Most failures will first be detected by processes that run periodically. In the case of individual resource failures, this will typically be a failed check script. In the case of entire servers, this will typically be detected by a missed heartbeat. In both cases, we don’t just take one failure and immediately initiate recovery. Instead, we retry and wait for multiple failures to verify true failure. As an example, deep check scripts, which do more involved resource status testing, are by default run every five minutes. This means that it may take up to five minutes to detect certain failures, and depending on the type of failure, may take even longer to verify. After we’ve detected and verified a failure, depending on the type of failure, we may then perform several attempts at local recovery. If it works, it can save some downtime, but if not, it adds a little more time to the failover downtime equation. After detecting a failure, verifying it, and attempting local recovery, we will then perform a failover. Depending on exactly what kind of failure it is, it can take a similar amount of time to the switchover downtime described previously. Adding all these potential sources of delay up, it can have the potential to really drive up downtime. Fortunately, most failures are able to be detected quickly, and similarly to switchovers described above, will barely be noticed by end users.
The second source of unintentional downtime is failed failovers. When these occur, they can really drive up the downtime, as they rely on a qualified technician to intervene and restabilize the systems correctly. These are somewhat rare, but they do happen. Fortunately, these are almost always preventable. The best way to be sure that failovers will go according to plan is to test them ahead of time. It can be quite easy to misconfigure something, but simply running a failover test will reveal any such issues. The other way to ensure that failovers will be successful is to ensure that your cluster is ready to fail over as often as possible. This means making sure that backup systems are up and running, and that resources are in an ISP (In Service Protected) state. For example, DataKeeper mirrors, which are not in a mirroring state, will not be ISP, and when a failure occurs, will not be able to fail over. To ensure that resources can be switched over, you should take measures to ensure that DataKeeper is mirroring as often as possible, and other resources are similarly up to date and ready for failover.
The last source of unintentional downtime is issues outside of LifeKeeper’s control. Network issues may cause both successful and unsuccessful failovers, but they can also render seemingly healthy clusters unreachable depending on how systems are set up. Similarly, issues with underlying cloud or virtualization software can cause issues beyond the scope of LifeKeeper. To prevent these, keeping systems as separate as possible allows LifeKeeper to rise above these issues. Clusters containing systems all residing in the same AZ or on the same network are far more vulnerable to issues than those containing diversified systems. Another area of issues beyond LifeKeeper’s control is internal application issues and human error. For example, the accidental deletion of critical data may cause issues for end users that would likely go undetected and unfixable by LifeKeeper. Employing backup software can help to recover from these types of issues, but cannot gain back the lost uptime. Lastly, high availability does not necessarily protect against bad actors and cybersecurity threats. Certain attacks may result in lost uptime. To prevent these, it is advisable to employ a trusted anti-virus/anti-malware software suite.
Avoidable Sources of Downtime
As alluded to in several of the above sections, there are many sources of downtime that are completely preventable. I won’t go into every type of preventable downtime here, but I’ll highlight a few of the most common.
When initially designing your cluster topology and design, there are a few things to consider. Split brains, which occur when both nodes believe they are the primary node, can be prevented by utilizing some form of quorum. If you are creating a gen app, make sure to write and use quick check and deep check scripts, so that failures are actually detected. Lastly, make sure to set up more than one communication path running across more than one NIC and network.
Improperly set up systems can also lead to downtime. A few of these have already been described. First, make sure that the applications being protected, the underlying OS, and the high availability software are all fully up to date using the latest versions. Plenty of downtime occurs due to already fixed bugs, which could have been completely avoided. Second, make sure to perform switchover and failover testing of clusters after setup and periodically. Many issues that would prevent successful failover can be detected and prevented ahead of time by performing this testing. Third, make sure that you are always operating with a backup node up and ready to take over.
Improperly configured systems can cause downtime. To prevent this, LifeKeeper and DataKeeper offer tunable parameters to optimize performance, heartbeat intervals, resource checks, and retry settings. While default settings are usually sufficient, any changes should be made with a clear understanding of their impact and necessity. Always prioritize guidance from SIOS Support, as their recommendations are based on extensive expertise and should be followed to ensure system reliability.
Author: Carter Chandler, Associate Software Engineer at SIOS