With an alternative approach to using standard and custom metrics for EC2 monitoring
Amazon CloudWatch is a monitoring and observability service that enables DevOps, site reliability engineers, and IT professionals to monitor their AWS environments. It is a service provided by AWS and is used by many companies because of its high affinity with AWS environments. This article explains what you can do with the standard Amazon CloudWatch monitoring configuration and what you can do with custom metrics and how complex it is to configure Amazon CloudWatch for custom metrics.
What standard and custom metrics can Amazon CloudWatch monitor?
Amazon CloudWatch allows you to monitor various items in the AWS environment and has two types of metrics: standard metrics, which can be monitored by default, and custom metrics, which can be set by the user themselves to enable monitoring.
Standard metrics include items such as EC2 instance CPU utilization, disk, and network usage, and instance status checks, and you can start monitoring them right away by simply setting up a threshold.
All other items can be monitored by the user by creating custom metrics. Amazon CloudWatch supports more than 70 AWS services, allowing you to achieve fine-grained monitoring with custom metrics tailored to your needs. For example, you can check the status of applications running on an EC2 instance. The standard metric “Instance Status Check” can be used to detect problems at the virtual machine and OS level, but you can also check the status of the application if you create custom metrics.
Configuring custom metrics with Amazon CloudWatch is not so simple
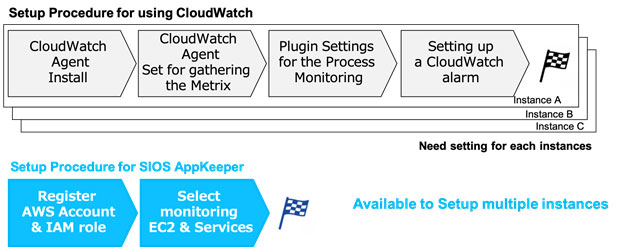
Let’s talk about how to set up custom metrics. In order for Amazon CloudWatch to monitor the operational status of an application running on EC2, it needs to create a metric that counts the number of processes running on the instance, and if the number of processes drops below a certain number (or reaches zero), it is declared abnormal.
You’ll need to install the Amazon CloudWatch agent on the instances to be monitored. While you can use a wizard during the configuration process, you will still need to know many details about the applications and their settings.
In addition, even within the same instance, you need to configure settings for each target process, and it is undeniable that monitoring multiple applications and processes can be quite time-consuming. To really get the most out of Amazon CloudWatch, you should also consider using a tool called “AWS CloudFormation”, which automates the configuration of resource settings by making them into templates.
Also, in terms of what to do after your custom metrics detect an anomaly, Amazon CloudWatch can only restart the entire instance, not the application or service. This means that if you have multiple applications running in the same instance, they will be all restarted together, even those that aren’t experiencing problems. If you want to restart only the application that is experiencing the anomaly, you need to integrate with services such as AWS Systems Manager and AWS Lambda, which raises the bar in terms of expertise required.

How to monitor and restart applications running on EC2
Amazon CloudWatch is said to “be an easy and cost-saving way to monitor AWS environments,” but when it comes to creating and operating custom metrics, it takes more effort than you might think. Even if you only want to monitor standard metrics, you will need information about the operational design, CPU usage thresholds, etc. This often requires advanced skills.
If you have a high-level system, such as SAP, you may need to spend a lot of time and effort to run it properly. But some solutions may not require that much effort and money to monitor and manage. If you want to easily achieve operations such as “Monitor the status of an application and restart it when it stops,” then Amazon CloudWatch may be too difficult for the average user to configure.
In this case, we suggest you evaluate using SIOS availability solutions. Contact the SIOS availability experts today to learn more about achieving maximum uptime for your mission-critical applications.


